
Key findings
- Great Britain construction activity remains soft in the near term: output fell 0.5% in the three months to July 2026, while new work fell 0.4% in July and private housing new work fell 4.9%. Policy announcements should therefore not be mistaken for immediate site activity (ONS, 2026) [[ons2026construction]].
- The demand signal is strengthening, particularly in infrastructure. NISTA’s March 2026 Pipeline covers 734 planned projects and £718 billion of public and private investment over ten years, but this is a forward pipeline rather than a forecast of annual construction output [[nista2026pipeline]].
- England’s annual new-build starts rose 15% to 130,170 in the year to March 2026, while completions fell 6% to 143,110. Reporting changes associated with the Building Safety Regulator also caution against reading a single-quarter rise in starts as a settled recovery [[mhclg2026housing]].
- The critical commercial issue is likely to be coincident demand for scarce delivery functions—surveys, design management, utilities coordination, supervision, procurement and specialist labour. NISTA’s workforce estimates are a useful planning signal, but not proof that labour shortfalls are inevitable [[nista2026skills]].
Thesis: the constraint is moving from permission to mobilisation
**Forecast horizon: September 2026 to March 2029.** Sanctuary’s central judgement is that construction is more likely to experience a selective, uneven recovery than a broad and immediate boom. Faster infrastructure planning and a clearer public investment pipeline can bring projects closer to market. They cannot, by themselves, produce surveyed, serviced, designed, procured and staffed sites.
This distinction matters now because the UK has a growing gap between **announced demand** and **productive activity**. In Great Britain, construction output fell by 0.5% in the three months to July 2026, ending four consecutive three-monthly increases. Monthly output increased by only 0.1% in July, supported by repair and maintenance; new work fell by 0.4%, including a 4.9% fall in private housing new work (ONS, 2026) ↗. These figures do not disprove a recovery. They do show that the recovery has not yet become broad-based new-work activity.
The practical implication is that the most valuable capabilities may sit before and around the main build package: site investigation, remediation, land and utility coordination, design assurance, programme controls, temporary works, logistics, procurement and skilled supervision. These activities determine whether consented schemes convert into reliable workloads or into delayed tenders, redesign and risk-priced contracts.
That is particularly important for local economies. A place can secure a major consent or capital commitment without generating sustained local value if local firms are not ready for framework requirements, if utilities and access works are unresolved, or if the procurement timetable gives SMEs no credible route into delivery. The economic-development challenge is therefore not simply to win projects, but to organise the conditions in which projects can mobilise, employ and retain local supply-chain capacity.
The evidence supports a stronger pipeline, not an immediate output forecast
The infrastructure case has become more tangible. NISTA’s March 2026 Pipeline identifies 734 planned projects and £718 billion of public and private investment over the coming decade, alongside regional and sectoral workforce analysis ↗. Separately, the UK’s 10 Year Infrastructure Strategy sets out at least £725 billion of economic and social infrastructure funding over ten years, with capital funding intended to grow in line with inflation after the Spending Review period ↗.
These figures should not be added together or treated as a single measure of committed construction spend. They arise from different policy documents and scopes. More importantly, a pipeline includes projects at varying stages of development, procurement and construction. It is a measure of potential future workload and strategic direction, not a timetable for site starts. That distinction is central to investment, recruitment and working-capital decisions.
Housing offers a similar warning against headline-led interpretation. In England, annual building-control-reported new-build starts increased 15% to 130,170 in the year to 31 March 2026. Yet annual completions fell 6% to 143,110. Starts in 2026 Q1 were 18% above a year earlier but 9% below the preceding quarter and remained 50% below the 2023 Q2 peak ↗. The data point to an improving flow of projects into the system, but not yet to a self-sustaining recovery in completed homes.
There is a further measurement caveat. MHCLG notes that elevated starts in late 2025 and early 2026 partly reflect Building Safety Regulator reporting; the regulator recorded 6,276 starts in 2026 Q1, above earlier quarterly maxima ↗. This is meaningful evidence that schemes are entering the recorded system. It is not a sound basis for mechanically extrapolating one quarter’s increase into future construction volumes.
Sanctuary’s interpretation is that infrastructure, regulated-asset investment and public-estate programmes may support selected civil engineering and specialist markets while housing and discretionary private development remain more uneven. The order of recovery is likely to matter: enabling works, servicing, design, remediation and procurement may strengthen before completion volumes do.
Planning reform can accelerate the front end—but may intensify delivery pressure
The July 2026 changes to the Nationally Significant Infrastructure Project regime are significant because they seek to reduce friction before an application is examined. Government states that the reforms remove mandatory pre-application consultation requirements, introduce more structured early technical engagement and targeted examination processes, and could reduce pre-application time by up to 12 months ↗. That estimate is a policy expectation, not yet evidence of a national reduction in delivery times.
The mechanism nevertheless matters. A quicker and more predictable route through consenting can allow clients to commit earlier to surveys, detailed design, supply-chain engagement and financing. It can also compress demand into the delivery system. If multiple schemes move forward together, the same technical advisers, statutory interfaces, design managers, utilities specialists, civils contractors and supervisors may be required at the same time.
Government’s implementation response makes clear that results depend on effective use of the new arrangements by applicants, practitioners, local planning authorities, statutory bodies and communities ↗. That is the counterweight to any simple claim that planning reform automatically creates construction output. Earlier technical resolution may reduce later delay; poorly managed early engagement may simply shift uncertainty into examination, detailed design or procurement.
The strategic question is therefore not whether consent is important—it plainly is—but whether clients and places can convert earlier consent into delivery-ready programmes. A scheme with permission but unresolved grid capacity, land issues, drainage, highways, abnormal costs or package strategy is not commercially equivalent to a scheme ready to mobilise. Treating both as equal pipeline creates a false sense of capacity and can lead to premature hiring, fragile bids and avoidable pressure on smaller suppliers.
Workforce modelling identifies exposure to coincident demand, not a single national shortage
NISTA estimates that Pipeline delivery could require an annual average construction and infrastructure workforce of 621,000–697,000 over two years and 629,000–706,000 over five years ↗. The value of these ranges is not that they predict a precise headcount. It is that they make visible the scale, geography and occupational composition of potential demand.
The methodology warrants care. It applies labour coefficients—people required per £1 million of work—by occupation and project type. Construction estimates draw on ONS data, while some engineering-construction coefficients use employer-provided data. Regional estimates reflect where work takes place rather than necessarily where workers live, and component manufacturing is excluded except for offshore-wind turbines ↗. The results should guide workforce and supply-chain planning, not be presented as an observed labour shortfall.
The more useful risk concept is **coincident demand**. A national pipeline may be credible in aggregate while still producing local failures when programmes require the same occupations, specialist subcontractors or utility interfaces in overlapping places and procurement windows. The resulting constraint may emerge not as an obvious national vacancy figure, but as repeated retendering, delayed mobilisation, narrow bid lists, inflated contingencies and weak risk allocation.
This has direct implications for SMEs and employability. Smaller firms are often well placed to provide surveys, enabling works, compliance, temporary works, maintenance, logistics and specialist installation. Yet they are least able to carry prolonged bid costs, uncertain sequencing or payment risk. Transparent forward plans, sensible package sizes and early capability-building can turn pipeline visibility into local business investment. Without them, the same visibility can encourage firms to overextend against work that arrives later than expected.
Financial conditions keep private new work conditional
The public and regulated pipeline does not remove the macroeconomic restraint on private development. In its July 2026 Monetary Policy Report, the Bank of England held Bank Rate at 3.75%, projected CPI inflation to rise to 3.2% in 2026 Q4, and described domestic demand as subdued through 2026 and early 2027 in its central projection ↗.
For construction, the effect is less a universal stop signal than a filter. Projects with regulated revenues, committed public funding or strong strategic rationale may proceed despite subdued demand. Marginal schemes dependent on debt costs, speculative lettings, pre-sales or rapid sales absorption are more exposed to financing conditions and changing risk appetite. This helps explain why a stronger infrastructure pipeline can coexist with weak private housing new work.
There is also an upside case. If financing conditions become more supportive while planning reform improves project progression, the recovery could broaden through 2027 and 2028. In that outcome, serviced land, utilities, affordable housing, civils, public-estate renewal and regional supply chains would benefit alongside larger infrastructure programmes. The downside is a paper pipeline: projects remain strategically endorsed but are delayed by funding decisions, design maturity, legal complexity, utility constraints or supplier risk pricing.
These are scenario judgements rather than statistical forecasts. Decision-makers should avoid committing on the assumption that all published projects have the same probability, timing or local economic effect. The better discipline is to monitor conversion: development to consent, consent to funded procurement, procurement to award, award to mobilisation, and mobilisation to productive output.
Sanctuary recommendations: make delivery readiness a local economic strategy
**For local authorities, mayoral bodies and place partnerships:** maintain a delivery-readiness register for priority housing and infrastructure sites. It should record the practical blockers—land, utilities, ecology, highways, planning conditions, design assurance, workforce and procurement route—with a named owner and dated action. This is more useful than a capital-project list because it identifies what prevents expenditure from becoming activity.
**For contractors and specialist SMEs:** use published pipeline intelligence to identify repeatable delivery problems, not only flagship schemes. Build demonstrable competence in the services that unblock mobilisation: surveys, enabling works, compliance, logistics, project controls and supply-chain coordination. Where appropriate, form delivery partnerships that can offer clients a credible combined package rather than isolated trade capacity. This improves access to larger programmes while reducing the cost of responding to fragmented procurement.
**For housing providers and developers:** distinguish permissioned land from mobilisable land. Stress-test utilities, abnormal costs, building-safety processes, procurement capacity and demand assumptions before treating consent as a delivery commitment. Phasing should be resilient both to slower sales or lettings and to sudden scarcity in specialist labour and supervision.
**For anchor clients:** procure for continuity rather than episodic competition alone. Clear forward work plans, proportionate prequalification, realistic risk allocation and consistent technical standards give suppliers a basis to hire, train and invest. This is an employability and productivity intervention as much as a procurement choice: predictable work enables SMEs to build management capability instead of absorbing volatility.
The central conclusion is deliberately conditional. Planning reform is valuable if it creates earlier, better-resolved projects. Its economic value will be limited if clients, local systems and supply chains cannot translate that speed into disciplined mobilisation. Over the next two and a half years, the strongest organisations will be those that treat delivery readiness as a strategic asset before the visible workload peak arrives.
Research foundation
References
- Office for National Statistics (2026). Construction output in Great Britain: July 2026. Office for National Statistics.Source ↗
- Ministry of Housing, Communities and Local Government (2026). Housing supply: indicators of new supply, England: January to March 2026. GOV.UK.Source ↗
- National Infrastructure and Service Transformation Authority (2026). Infrastructure Pipeline update signals future workforce needs. GOV.UK.Source ↗
- National Infrastructure and Service Transformation Authority; Whole Life Consultants Limited; CITB; Cogent Skills; ECITB; Energy & Utility Skills; National Skills Academy for Rail (2026). Workforce forecasting methodology. UK Infrastructure Pipeline.Source ↗
- Ministry of Housing, Communities and Local Government (2026). Fastest infrastructure building in a generation as planning rules overhauled. GOV.UK.Source ↗
- Ministry of Housing, Communities and Local Government (2026). Consultation on streamlining infrastructure planning: government response. GOV.UK.Source ↗
- HM Treasury (2025). UK Infrastructure: A 10 Year Strategy. GOV.UK.Source ↗
- Bank of England Monetary Policy Committee (2026). Monetary Policy Report: July 2026. Bank of England.Source ↗
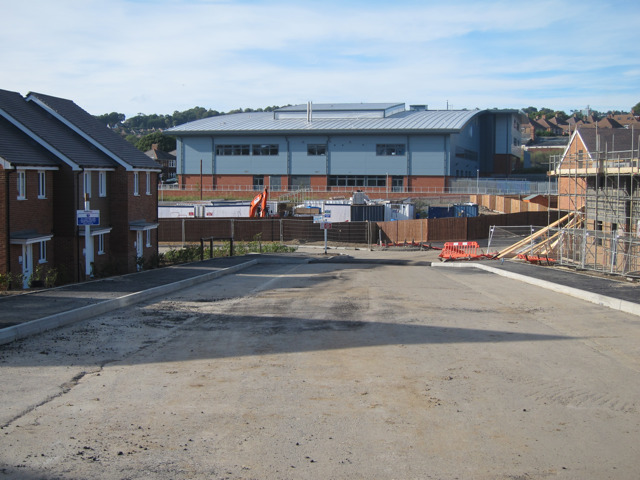
- Oast House Archive. Hero image: New housing estate under construction - geograph.org.uk - 2550490.jpg. Wikimedia Commons · CC BY-SA 2.0.Image source ↗
Related Sanctuary capabilities
From analysis to implementation.
Discussion
No approved comments yet.