
Key findings
- Pride in Place moves rapidly from plan-making to delivery: 160 Phase 2 plans are due by 30 November 2026 and a further 40 by 26 February 2027. The quality of local delivery arrangements will matter as much as the project list. [[mhclg_pip_delivery_2026]]
- Evidence from the Towns Fund supports targeted intervention, but not capital determinism. Future High Streets Fund locations recorded footfall 6.7% higher than matched non-funded towns, while short-run effects on business numbers were mixed. [[mhclg_towns_evaluation_2026]]
- National retail demand and town-centre use should not be conflated. Retail sales volumes rose in the three months to August 2026, while high-street footfall fell year-on-year in September. [[ons_retail_aug_2026]] [[brc_footfall_sep_2026]]
- The central 2027–29 risk is not simply a shortage of projects. It is failure to protect access during delivery, convert visits into local trading, and fund the stewardship needed once capital works are complete.
The thesis: 2027 is an implementation test, not a regeneration finish line
England’s town-centre policy is entering a more consequential phase. The question is no longer principally whether local places can assemble an attractive bid or identify a visible capital project. It is whether they can operate a coherent local system around that investment: maintaining access during works, supporting businesses through disruption, creating reasons to visit beyond a single purchase, and sustaining the place after grant-funded activity ends.
That distinction matters now because Pride in Place is designed at meaningful scale. The programme covers 284 communities and provides up to £5.8 billion over ten years. Its immediate delivery timetable is compressed: 160 Phase 2 plans are due by 30 November 2026, followed by 40 by 26 February 2027. The programme also expects places to progress towards community-led delivery by the end of year three. (Ministry of Housing, Communities and Local Government [MHCLG], 2026) ↗ (MHCLG, 2026) ↗
The Sanctuary forecast is therefore conditional rather than deterministic. Between 2027 and 2029, the stronger outcomes are likely to emerge where capital investment is joined to practical mobility, active management and a credible local-enterprise proposition. Places that deliver attractive assets without these connections may still improve appearance and sentiment, but are less likely to secure durable commercial and social value.
This is not an argument against public-realm investment. Well-designed physical change can alter behaviour and confidence. It is an argument against treating construction completion as the outcome. For a high street, the economic test is whether people can reach it, move through it, stay for longer, use a wider range of services, and generate viable demand for local firms.
What the evidence supports—and what it does not
The Towns Fund evaluation provides the strongest available basis for cautious optimism. Future High Streets Fund towns recorded footfall 6.7% higher than matched non-funded towns. By the third quarter of 2025, funded towns had recovered to 97.9% of their third-quarter 2019 monthly footfall, compared with 91.3% in non-funded towns. Across ten case-study towns, visible projects tailored to local needs were also associated with a 3.8-percentage-point improvement in pride in place. (MHCLG, 2026) ↗
Those findings challenge the view that town-centre intervention cannot influence local behaviour. They also support a practical case for locally tailored, visible schemes. Yet the evaluation should not be read as proof that every capital scheme generates self-sustaining growth. It could not robustly assess longer-term economic activity, and its business-count findings were mixed. Town Deals showed a positive but model-sensitive relative trend, whereas Future High Streets Fund locations showed short-run relative reductions in business numbers—an outcome the evaluation identifies as plausibly related to disruption during delivery. (MHCLG, 2026) ↗
The mechanism is important. Footfall is an intermediate indicator, not a complete economic outcome. More visitors may reflect improved attractiveness, confidence or accessibility, but footfall alone does not show who visited, how long they stayed, whether they spent with independent firms, or whether businesses could survive the disruption needed to deliver the scheme. A place can gain visitors while losing local traders if access, rents, loading, procurement and communications are poorly managed.
There is a reasonable counterargument: capital projects can unlock private confidence, improve safety and create a platform for later investment even before business data respond. The Towns Fund evidence gives that argument credibility. The implication, however, is to judge schemes over an appropriate period and against a chain of outcomes—not to substitute ribbon-cutting for evidence of local economic conversion.
Access is the link between physical investment and local economic value
Town-centre renewal is often framed as a property or public-realm challenge. Over the next cycle it is equally an access challenge. Department for Transport guidance notes that 70% of journeys in England were under five miles in 2024 and places local transport within a wider agenda of economic activity, housing and access to services. (Department for Transport [DfT], 2026) ↗
This matters because a high street is not used in isolation. Visitors make linked journeys between homes, bus stops, parking, schools, health services, workplaces, civic spaces and shops. If a streetscape scheme improves the central square but weakens wayfinding, bus interchange, loading arrangements or safe routes for people walking and wheeling, its commercial effect may be diluted. Conversely, modest interventions at gateways and along everyday routes can make a centre more usable without relying on a single landmark project.
There is a material opportunity to align place and transport programmes. The Local Transport Grant provides £2.3 billion across the spending-review period for smaller cities, towns and rural areas outside principal city-region funding streams, including £2.2 billion of capital funding over four years and more than £100 million of resource funding over three years. Eligible priorities include public transport, accessibility, congestion, zero-emission buses, and safer streets for walking and cycling. (DfT, 2025) ↗
The Sanctuary interpretation is not that every town needs the same transport answer. Market towns may need reliable buses, practical parking management and loading arrangements. Denser centres may gain more from safe walking routes, cycling provision, evening safety and legible interchange. The analytical point is that place-making and local transport decisions now overlap in time. Places that design them together before schemes are committed will retain more options than those trying to repair access problems after construction begins.
Why retail sales and footfall need to be read together, not treated as a verdict
The latest national indicators illustrate why town-centre performance cannot be inferred from a single series. Great Britain retail sales volumes rose by 0.9% in the three months to August 2026, while non-food store volumes rose by 0.2%. In contrast, BRC-Sensormatic data recorded a 3.0% year-on-year decline in high-street footfall in September 2026 and a 2.9% fall across total UK retail footfall. (Office for National Statistics [ONS], 2026) ↗ (British Retail Consortium [BRC], 2026) ↗
These results are not necessarily contradictory. Retail sales measure purchases, while footfall records visits to monitored retail destinations. Changes in online purchasing, trip frequency, weather, promotional timing and dwell behaviour can move the two measures in different directions. Neither series can establish whether a particular town-centre intervention has succeeded.
For local leaders, the lesson is to build a small but balanced performance framework. It should combine: access indicators such as bus reliability, gateway counts and barriers reported by disabled users; activation indicators such as weekday, evening and event use; enterprise indicators such as independent-business openings, closures, occupancy duration and vacancy-to-trading time; and stewardship indicators such as maintenance response times, delivery milestones and the existence of post-project revenue plans.
This should be a management tool rather than a reporting burden. If pedestrian counts rise while independent occupancy falls, the relevant question is not whether footfall has been “won”. It is whether affordability, leasing practice, construction disruption or weak demand conversion is preventing local firms from benefiting. That diagnostic discipline is particularly important for SMEs, which generally have less working capital to absorb a prolonged period of disrupted access.
Three plausible paths for 2027–29
**Base case: selective improvement, with a wider gap between places.** Most funded towns will deliver visible early wins and progress a limited number of larger projects. The better performers will combine Pride in Place investment with transport planning, practical business engagement and programmes that broaden use across the day. Others will improve the physical environment but secure only modest commercial spillover because access, activation or stewardship remains fragmented. This is the most credible central case given both the positive footfall findings and the evidence of transitional business disruption. (MHCLG, 2026) ↗
**Upside case: managed town-centre districts emerge.** A meaningful minority of places use the 2026–27 plan window to establish capable delivery vehicles, coordinate with transport authorities, develop a pipeline of independent occupiers and meanwhile uses, and protect customer access during works. These places turn visible improvements into repeat visits, stronger local trading and more investible mixed-use propositions. The catalyst is not simply additional capital; it is earlier alignment between delivery ownership, mobility, revenue funding and local market demand.
**Downside case: completed projects without local conversion.** Some plans become long project lists with insufficient operational capacity. Works disrupt businesses, temporary activity stops when grant funding ends, and assets lack a defined operating owner or maintenance budget. In this scenario, national footfall fragility compounds local delivery risk and undermines confidence among small businesses.
These are scenarios, not numerical predictions. Their value is in making the choices visible. A town cannot control all consumer conditions, but it can control whether its investment programme has a delivery owner, a disruption plan, a local-enterprise route and a viable long-term operating model.
The decision points local leaders should prioritise now
The immediate priority for local authorities and Neighbourhood Boards is to make the first four-year plan operationally testable. For every capital intervention, the plan should identify the user problem being solved, the access arrangements during and after construction, the accountable operating owner, annual revenue requirements, the likely opportunity for local enterprise, and the measure that would trigger adaptation if the scheme is not working.
There are potential sources of momentum. Phase 2 plans with realistic investment programmes, named delivery responsibilities and credible management arrangements should be better placed to move from aspiration to action. (MHCLG, 2026) ↗ Town-centre priorities embedded in local transport planning should also be more likely to improve everyday access than isolated streetscape schemes. (DfT, 2026) ↗ The announced £301 million High Streets Innovation Partnerships commitment may create a further route to test approaches to mixed use, safety, community and enterprise, although allocations were not confirmed in the March 2026 announcement. (MHCLG, 2026) ↗
For businesses and entrepreneurs, the useful contribution is evidence rather than generic lobbying: customer-journey data, unmet service needs, delivery constraints, viable meanwhile uses and propositions that extend activity beyond conventional shopping hours. This helps a place design for local value creation rather than simply seek promotional support.
**Sanctuary recommendation:** before major procurement begins, apply an “access-to-local-value” review. It should ask five questions: can people reach the centre; can they move through it; is there a reason to stay; can local firms convert demand into income; and who is funded to maintain the result? This is a proposed decision framework, not an externally validated scoring model.
The forecast would be weakened if monitoring showed that places with limited operating capacity consistently matched the sustained outcomes of places with strong partnerships and stewardship. It would be reinforced by persistent post-project vacancy, reduced accessibility, delivery slippage or activity that disappears when grant funding ends. Those are the signals boards should monitor before declaring success or failure.
Conclusion: measure the chain, not the asset
England has a significant overlap of long-term neighbourhood funding, current evidence from town-centre programmes and multi-year local transport resources. That combination creates a real opportunity between 2027 and 2029. The evidence supports locally tailored, visible intervention; it does not support an assumption that physical change alone will produce durable local growth. (MHCLG, 2026) ↗
The most useful forecast is therefore straightforward. Places that connect access to activity, activity to local enterprise, and enterprise to stewardship should outperform those that measure progress chiefly through spend and completed assets. The coming plan and delivery period will reveal which towns have built that chain—and whether they can sustain it after the capital works are finished.
Research foundation
References
- Ministry of Housing, Communities and Local Government (2026). Pride in Place Programme: prospectus. GOV.UK.Source ↗
- Ministry of Housing, Communities and Local Government (2026). Pride in Place programme: delivery guidance. GOV.UK.Source ↗
- Ministry of Housing, Communities and Local Government (2026). Towns Fund evaluation: final findings – summary for policymakers. GOV.UK.Source ↗
- Department for Transport (2026). Local transport plans. GOV.UK.Source ↗
- Department for Transport (2025). Capital allocations: 2026 to 2027 and 2029 to 2030. GOV.UK.Source ↗
- Office for National Statistics (2026). Retail sales, Great Britain: August 2026. Office for National Statistics.Source ↗
- British Retail Consortium (2026). Budget must deliver for shoppers as footfall drops. British Retail Consortium.Source ↗
- Ministry of Housing, Communities and Local Government (2026). High streets revived and children given safe places to play. GOV.UK.Source ↗
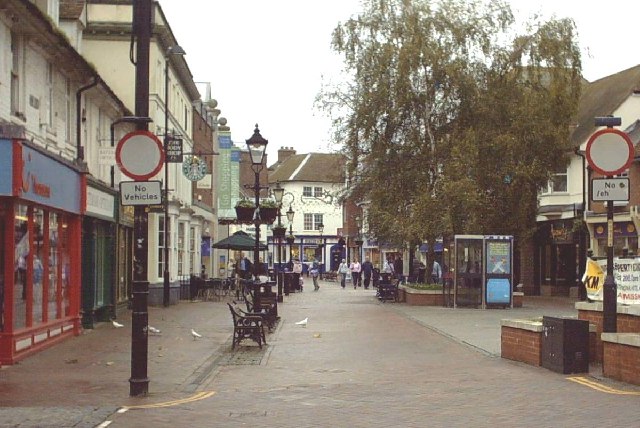
- Adam Colton. Hero image: Ashford Town Centre - Upper High Street - geograph.org.uk - 74845.jpg. Wikimedia Commons · CC BY-SA 2.0.Image source ↗
Related Sanctuary capabilities
From analysis to implementation.
Discussion
No approved comments yet.