
Key findings
- Retail sales volume growth shows that demand has not disappeared, but weather, sporting demand and promotions make it a weak basis for broad discretionary stock commitments.
- Sales, public-opinion and footfall indicators measure different stages of the customer journey. Together, they point to uneven category demand, active comparison and place-specific trading conditions.
- Household pressure is driven by unavoidable costs as well as shop prices. Retailers should distinguish affordability, confidence and convenience barriers before reaching for blanket discounting.
- Peak campaigns should be judged on incremental contribution after discounts, media, fulfilment, returns, labour and markdown risk—not revenue or sell-through alone.
- For SMEs and high streets, accurate local availability, collection and specialist service are productivity capabilities: they make scarce purposeful visits more likely to convert.
The winter question is profitable conversion, not whether consumers will spend
The UK retail outlook for winter 2026–27 is best understood as **selective resilience**. Household spending is still reaching retail, but it is not spreading evenly across categories, locations or price points. That distinction matters because the costs of misreading the market are asymmetric. Overconfidence can leave retailers carrying excess seasonal stock, fixed labour costs and January markdown exposure. Excess caution can mean being unavailable when customers have a timely and well-defined reason to buy.
Retail sales volumes in Great Britain rose by 0.9% in the three months to August 2026, 2.4% on a year earlier, and 0.5% in August itself. The Office for National Statistics identified strong June trading, weather-sensitive purchases, sporting merchandise and earlier promotional activity as influences on the summer pattern. This is meaningful evidence that spending power and retail demand have not vanished. It is not, however, a reliable forecast of a broad-based winter appetite for discretionary goods. Seasonal weather, events and promotion timing can lift aggregate sales without creating durable demand across the market. (Office for National Statistics, 2026) ↗
The commercially useful question is therefore not whether consumers will spend, but which purchase missions they will prioritise and what prevents completion. Gifting, replacement purchases, convenience purchases and high-ticket discretionary items carry different exposure to household budgets, perceived risk, availability and delivery reliability.
This changes the operating objective. Revenue is not economically equal across products or channels: its value depends on the discount required, acquisition cost, fulfilment and returns expense, incremental labour and the markdown risk left in stock. Winter buying, pricing and channel decisions should consequently be governed by expected contribution and stock productivity, rather than by a general belief that a stronger sales headline justifies broader commitments.
There is a counterargument worth taking seriously. A retailer that assumes caution in every category can miss a release of deferred demand, particularly around seasonal or clearly purposeful purchases. The appropriate response is not blanket optimism, but option value: flexible replenishment, selected supplier capacity and pre-agreed reorder triggers are safer than making the same inventory bet across categories with very different demand conditions.
Fragmented indicators describe a fragmented customer market
Late-summer evidence should not be forced into one verdict. ONS retail statistics measure sales volumes and values; the BRC-KPMG monitor has different coverage and construction; and footfall records visits rather than transactions, basket value or store profitability. These are not interchangeable measures. Their divergence is expected—and commercially useful—when interpreted with care.
The combined picture suggests uneven demand. Alongside the ONS increase in retail volumes over the three months to August, BRC reported total retail sales growth of 0.7% year on year in August. Food sales rose by 2.6%, while non-food sales fell by 0.8%. Those figures should not be treated as a direct reconciliation with the ONS series, but they do reinforce an important trading discipline: a positive aggregate retail headline should not automatically become a broad non-food buying plan. (Office for National Statistics, 2026) ↗ (British Retail Consortium, 2026) ↗
Public-opinion evidence supplies a plausible mechanism, while remaining distinct from transaction data or a sales forecast. In August, 55% of adults said their cost of living had increased over the previous month. Among those reporting an increase, 59% said they had reduced non-essential spending and 43% said they were shopping around more. Food, fuel and household energy were the pressures most often identified. This is consistent with customers continuing to purchase while delaying decisions, reducing basket size, trading down or favouring retailers that are easier to compare. (Office for National Statistics, 2026) ↗
For management teams, the implication is straightforward: category conversion, basket mix, stock turn and repeat demand should carry more weight than a single national sales statistic. The key diagnosis is whether weakness is concentrated in a price tier, product mission, location or channel. That is far more actionable than the broad claim that the consumer is either resilient or under pressure.
For SMEs, this diagnosis need not require a sophisticated data platform. A disciplined weekly view of enquiries, conversion, average transaction value, returns, stock-outs and reasons for lost sales can reveal whether the constraint is price, range, confidence or convenience. The management capability lies in turning that information into a specific response rather than a general discount.
Affordability is a household-budget issue, not simply a ticket-price issue
The inflation and monetary backdrop supports targeted value rather than indiscriminate discounting. The Bank of England maintained Bank Rate at 3.75% in September and reported CPI inflation of 3.1% in August, expecting inflation to rise further over subsequent quarters as energy-price effects fed through. (Bank of England, 2026) ↗
The composition of inflation matters as much as the headline rate. In August, CPI inflation was 1.3% for food and non-alcoholic beverages, 4.6% for transport, 6.0% for electricity, gas and other fuels, and 2.7% for CPIH goods. A retailer can hold its own prices steady and still meet weaker willingness to commit, because unavoidable costs consume more of a household’s available budget. (Office for National Statistics, 2026) ↗
That mechanism explains why a universal discount response can be wasteful. Some customers face an affordability barrier: they want the product but cannot justify the outlay at that moment. Others face a confidence barrier, where uncertainty over fit, compatibility, quality, delivery or returns raises the perceived cost of a mistake. A discount may help the first group, but it can subsidise customers who would have bought anyway and does little for the second.
**Sanctuary recommendation.** Retailers should report affordability, confidence and convenience barriers separately in conversion analysis, customer-service feedback and campaign planning. Entry-price options, smaller formats and carefully governed payment choices can address affordability. Clear product information, fit or compatibility advice, transparent delivery and returns, and reliable local availability can reduce uncertainty without automatically giving away margin.
This is particularly relevant to smaller firms. SMEs are rarely best placed to sustain a price contest with national chains and marketplaces. Their defensible advantage is often reducing the time, effort and risk involved in making the right purchase. That improves customer value, but it is also a productivity strategy: fewer preventable enquiries, failed deliveries and unsuitable purchases protect staff time and contribution.
Channel and place should be managed as one economic system
Digital activity is now integral to discovery, comparison and fulfilment, particularly in non-food. ONS reported that online spending values rose by 1.9% in the three months to August, with online sales accounting for 28.8% of retail spending in August, up from 28.4% in July. BRC reported that online represented 36.4% of non-food items purchased in August. The different denominators mean these are not competing estimates. Their shared implication is that a substantial proportion of retail activity is digital, even where a customer’s final transaction or service interaction occurs in store. (Office for National Statistics, 2026) ↗ (British Retail Consortium, 2026) ↗
Physical demand is also differentiated by destination. UK footfall was 1.7% lower year on year in August, but retail-park footfall rose by 1.0%, compared with falls of 3.1% on high streets and 0.5% in shopping centres. Footfall cannot establish why those differences occurred, nor can it determine the profitability of a particular store. It does show why a single national assumption about physical retail is too blunt for estate decisions, local policy or town-centre investment. (British Retail Consortium and Sensormatic, 2026) ↗
The relevant economic unit is the customer journey, rather than the website and store treated as separate profit centres. A store can create value through collection, returns, demonstrations, advice and local problem-solving even when digital activity initiates the sale. Conversely, apparently strong online revenue may be low quality if paid acquisition, fulfilment and returns consume gross margin.
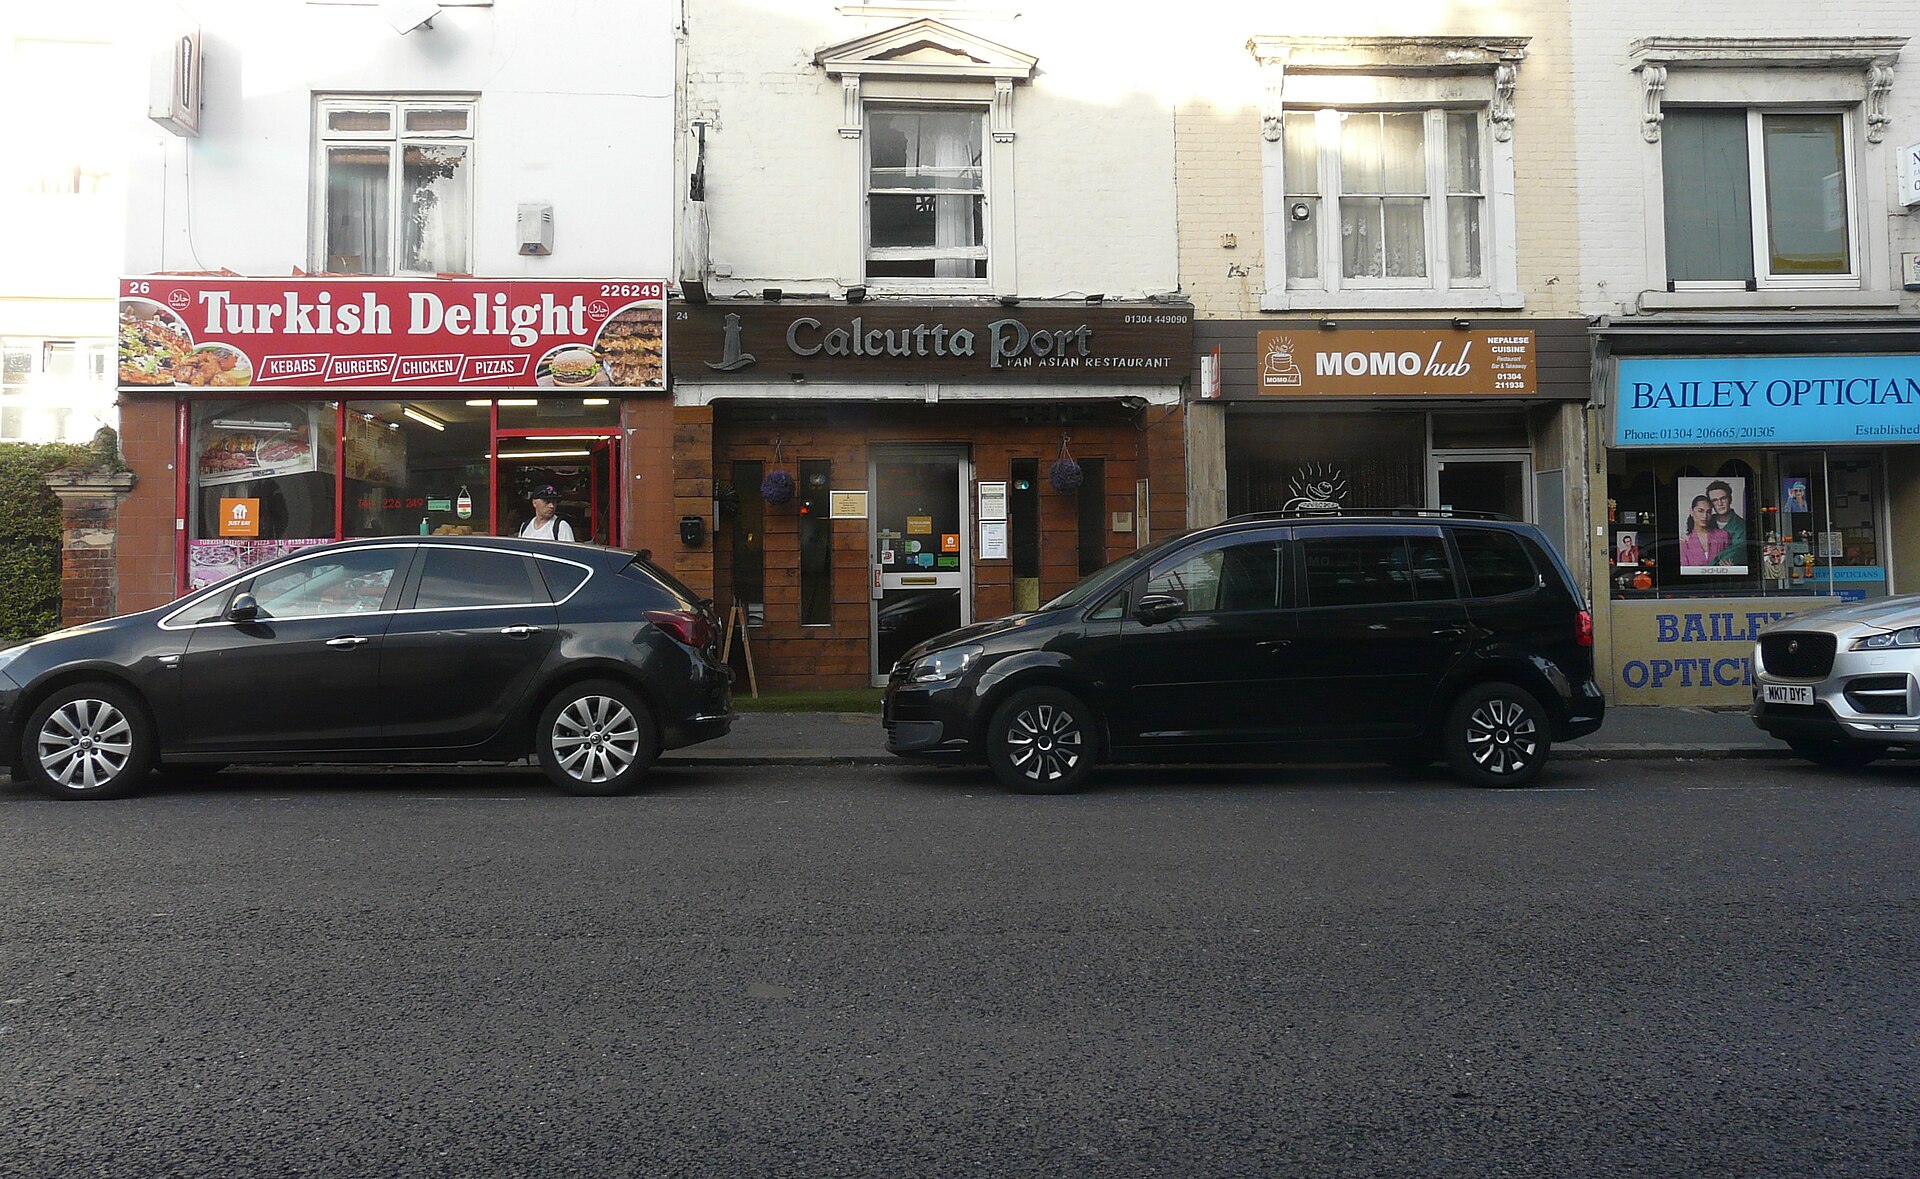
For independents and high streets, lower ambient traffic increases the value of a purposeful visit. Search listings, accurate stock information, collection options and specialist service should be treated as commercial infrastructure, not peripheral marketing. They reduce customer search costs and make premises and staff more productive. Place leaders can reinforce this through coordinated local discovery, wayfinding and convenient collection or returns, helping convert visits into linked spending across the local economy.
Promotions need an incrementality test, not a revenue target alone
Peak trading exposes a recurring analytical error: treating a change in purchase timing as new demand. ONS reported that some non-store retailers attributed lower July sales to promotions brought forward into June. It also identified earlier promotional activity and stock availability as influences on department-store and clothing performance. This does not demonstrate that promotions fail. It does show that a visible sales spike can include borrowed demand and avoidable margin loss. (Office for National Statistics, 2026) ↗
The appropriate test is incremental contribution. Did an activity win customers who would otherwise not have bought? Was the additional demand profitable after discount, media, fulfilment, returns and service costs? Did it reduce inventory in line with a replenishment plan, or create a credible route to profitable repeat purchase? A campaign can meet a revenue target while weakening cash generation if it advances demand, trains customers to wait for a sale or produces a sharper post-event slowdown.
**Sanctuary recommendation.** Before peak, trading, finance, marketing and operations should agree the costs included in contribution, a working definition of incrementality and clear promotional approval authority. Larger retailers should use credible product, audience or location controls where feasible, rather than relying solely on before-and-after comparisons that are vulnerable to seasonality. Smaller firms can improve decisions by comparing promotion-period margin, sell-through, returns and subsequent demand with normal trading patterns.
One post-campaign scorecard should cover revenue, gross contribution, stock productivity, acquisition cost, returns and repeat purchase. The goal is not to eliminate promotions. It is to distinguish genuine demand creation from demand brought forward, and to stop needless subsidy of customers already likely to buy.
Use operating triggers to manage uncertainty
A credible winter plan should be conditional rather than falsely precise. In its July Monetary Policy Report, the Bank of England projected subdued household-spending growth and expected energy-price effects to weigh on real-income growth. It anticipated weaker consumption growth in subsequent quarters, but not a sharp contraction. This supports a base case of selective resilience while leaving material uncertainty around household bills and discretionary demand. (Bank of England, 2026) ↗
In a **selective-resilience base case**, seasonal food, gifting, convenience and well-priced replacement purchases support stable to modestly positive demand, while high-ticket discretionary spending remains cautious. In an upside case, easing pressure releases deferred needs first in categories with a clear purpose; selected supplier options are preferable to blanket stock commitments. In a downside case, pressure from bills, transport costs or wider price pass-through reduces discretionary frequency into January and spring; value tiers, repair, replacement and smaller treats may be more resilient than high-ticket purchases. These are planning scenarios, not forecasts.
Each scenario needs explicit triggers and consequences. Retailers should track three-month sales-volume trends, category conversion, basket mix, return rates, promotional contribution and destination-specific footfall. Thresholds should be agreed in advance and linked to decisions on reordering, labour deployment, media allocation and supplier communication. This is more robust than repeatedly changing direction in response to noisy monthly headlines.
For high streets, the August gap between high-street and retail-park footfall is also a productivity concern. Fewer visits weaken the viability of businesses and services that depend on linked trips. Better access, wayfinding, local digital discoverability, collection and returns will not remove the household-budget constraint, but they can improve conversion from the demand that is present. (British Retail Consortium and Sensormatic, 2026) ↗
**Sanctuary judgement.** Winter 2026–27 is unlikely to reward generic optimism or blanket retrenchment. It is more likely to reward retailers and places that convert constrained attention into high-confidence, contribution-positive purchases through disciplined stock, credible value, integrated channels and stronger management capability.
Research foundation
References
- Office for National Statistics (2026). Retail sales, Great Britain: August 2026. Office for National Statistics statistical bulletin.Source ↗
- Office for National Statistics (2026). Consumer price inflation, UK: August 2026. Office for National Statistics statistical bulletin.Source ↗
- Office for National Statistics (2026). Public opinions and social trends, Great Britain: August 2026. Office for National Statistics bulletin.Source ↗
- Bank of England Monetary Policy Committee (2026). Bank Rate maintained at 3.75%: September 2026 Monetary Policy Summary and Minutes. Bank of England.Source ↗
- Bank of England (2026). Monetary Policy Report: July 2026. Bank of England.Source ↗
- British Retail Consortium (2026). Consumer demand cools as summer ends. BRC-KPMG Retail Sales Monitor.Source ↗
- British Retail Consortium; Sensormatic (2026). Sluggish footfall shows why retail needs Budget boost. BRC-Sensormatic Footfall Monitor.Source ↗
- John Baker. Hero image: Retail outlets, High Street - geograph.org.uk - 7644448.jpg. Wikimedia Commons · CC BY-SA 2.0.Image source ↗
Related Sanctuary capabilities
From analysis to implementation.
Discussion
No approved comments yet.